Understanding mobility means seeing connections
Traffic, parking space, and visitor flows change depending on the time of day, weather, or events. Citymonitor makes these connections visible and creates a shared decision-making basis for planning, operations, and information.
Mobility is measured selectively – but rarely understood in context
Mobility is dynamic and situation-dependent. Continuous data collection, combining different sources, and contextualizing with data such as weather or events is challenging in daily operations.
Typical consequences in municipal operations
Mobility as a continuous overall picture
Citymonitor creates a holistic view of mobility by continuously collecting traffic data, integrating existing data sources, and linking relevant contextual information. This creates reliable overviews of traffic, parking space, and people frequencies that can be used across departments – in ongoing operations as well as for planning, operations, and information.
Traffic flow optimization in real-time
People frequencies and utilization at a glance
Parking management and occupancy level
Selected packages for core use cases
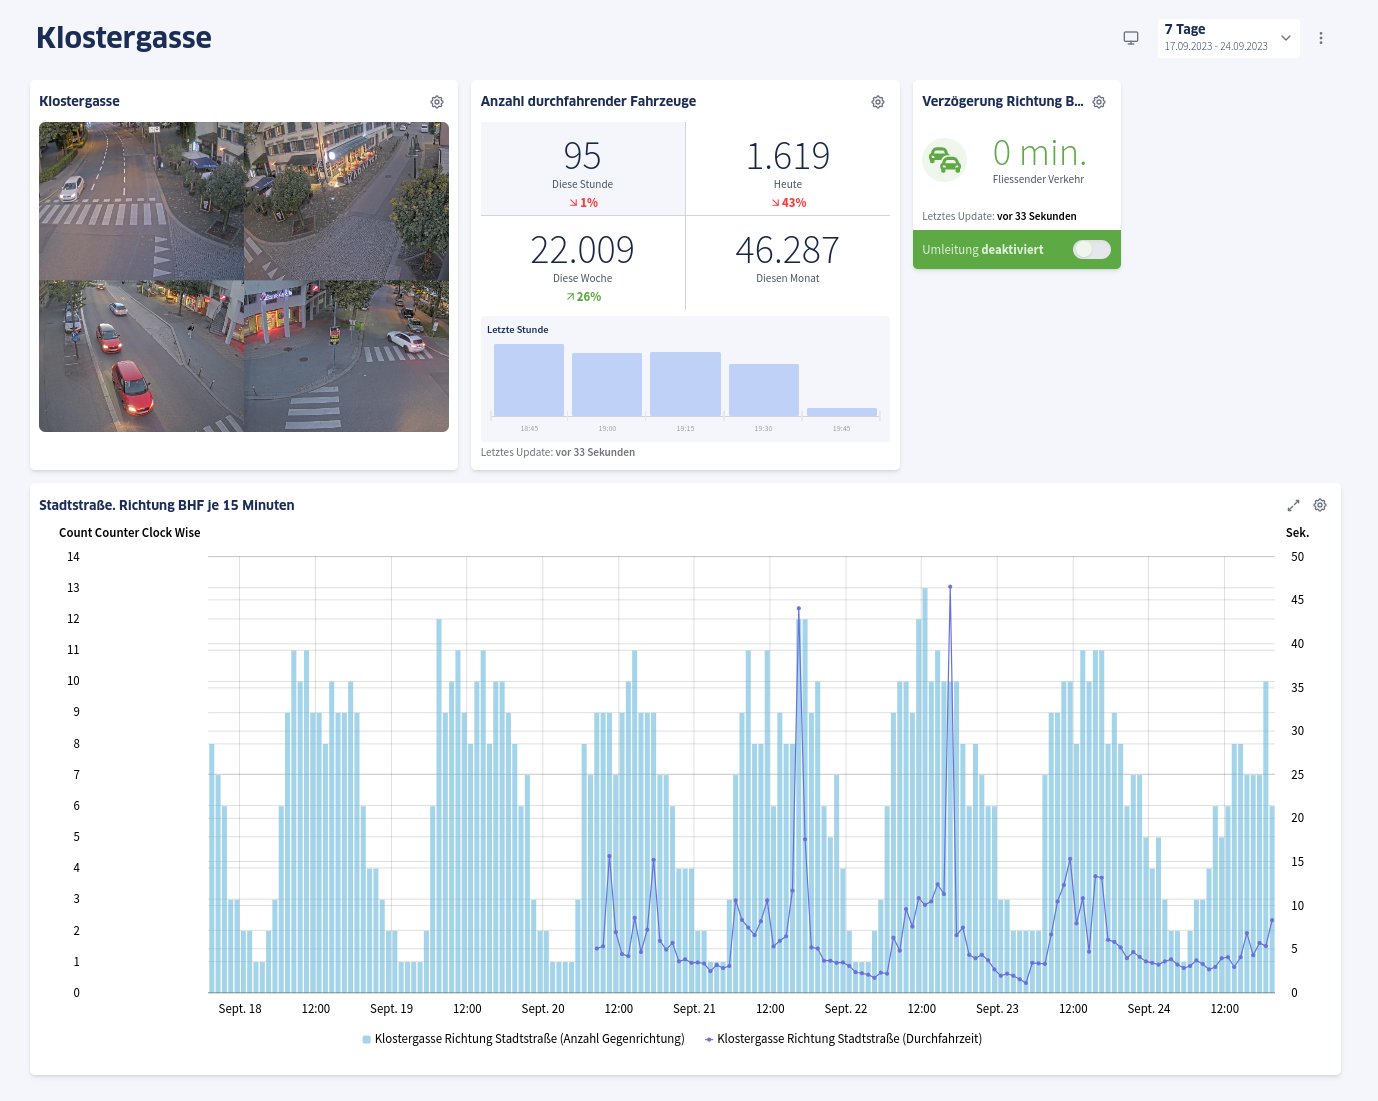
Continuous situational picture of traffic flow
The package continuously displays utilization, speed, traffic frequencies, and delays. Planners and operators receive a shared view of the current traffic situation that can be used across departments – in everyday life as well as during special events.
Shared traffic situation
Utilization, speed, frequency, and delays in a coordinated view – instead of isolated individual measurements
Current developments visible
Continuously observe and assess changes in traffic volume and delays
Reliable planning basis
Compare developments over time and use as a basis for further steps
Challenge
Data on traffic flow, utilization, and delays originates from different sources – such as counting systems, traffic-related sensors, or external platforms.
In the event of an incident, it is time-consuming to bring this information together, keep it up to date, and make it usable for different stakeholders.
Approach
Citymonitor bundles relevant data sources on traffic flow and continuously displays utilization, speed, frequencies, and delays. Different measurements are brought together in a shared view and made accessible across departments.
This enables
- Continuous overview of utilization, speed, frequencies, and delays
- Comparison of traffic situations across time periods
- Making load peaks, disruptions, and changes visible
- Use of data for planning, operations, and information
Particularly relevant for
Traffic Planning & Operations
- Shared situational picture of traffic flow and delays as a basis for coordination and assessment
Urban Planning
- Comparable time series on utilization and speed for infrastructure and measure planning
Citizens
- Understandable presentation of the current traffic situation and possible delays
Reuse
- Transfer of traffic information to citizen information or existing systems
- Export and use in other applications
- Combination with parking space and visitor frequency data
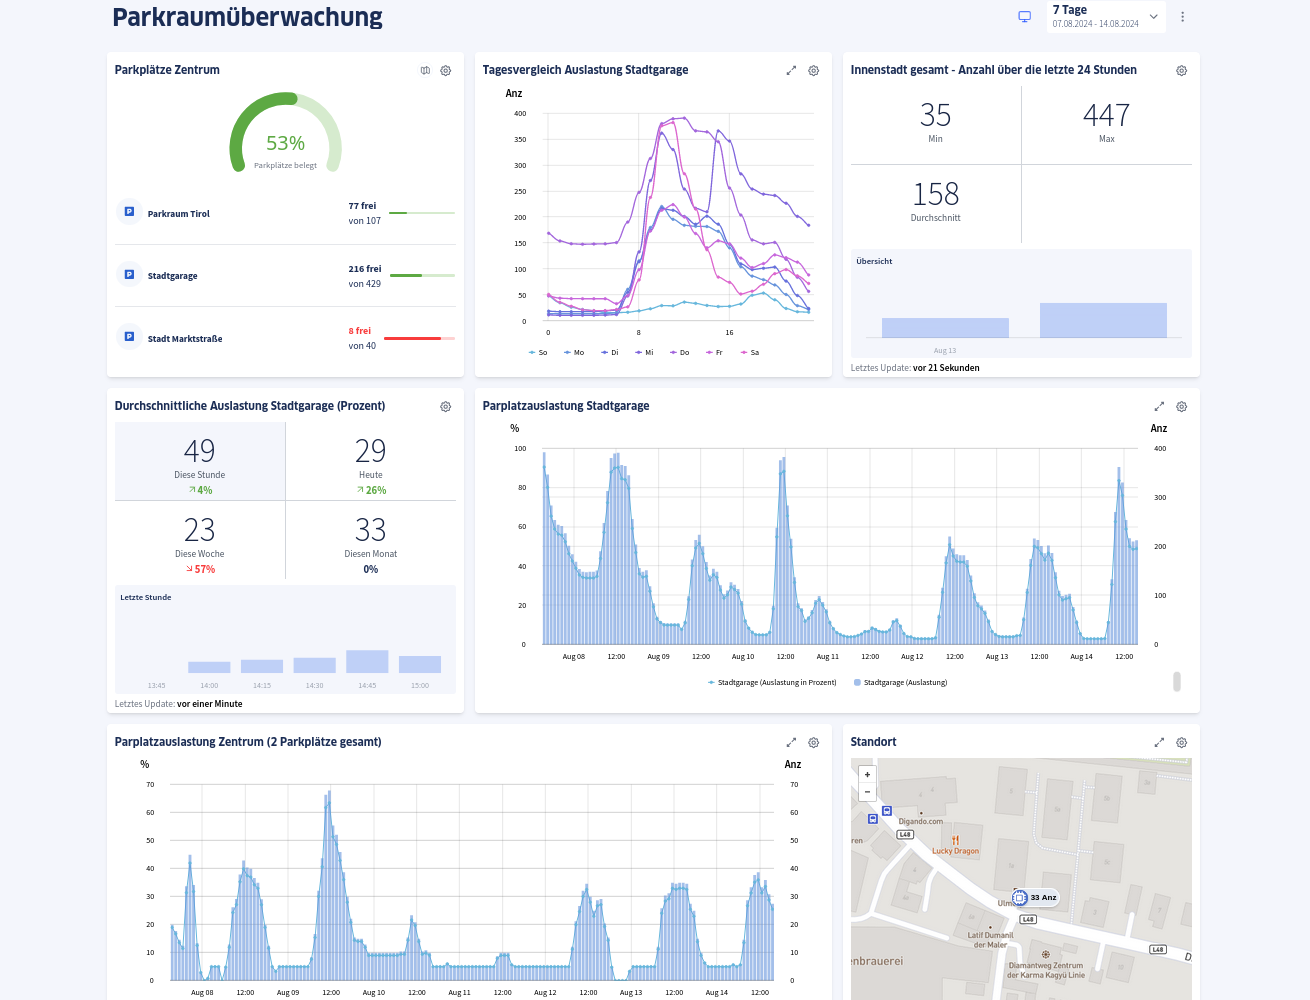
Occupancy and use of parking space
The package continuously displays parking space utilization and parking times. Municipalities receive an overview of where parking space is used, how long spaces are occupied, and how the situation changes over time – as a basis for operations, planning, and citizen information.

Spatial overview
Display occupied and available parking spaces in the city area together
Utilization & parking time
Compare usage and parking duration and track developments
Provide information
Use current parking information for different target groups
Challenge
Parking data originates from different systems – such as parking guidance systems, sensors, access or barrier systems, as well as manual surveys.
Without consolidation, there is a lack of consistent view of occupancy, parking times, and usage.
Approach
Citymonitor brings together different parking data and displays occupancy and parking times clearly. Existing systems are integrated as well as new sensors. Developments can be classified spatially and temporally.
This enables
- Continuous overview of parking space utilization
- Comparison of parking times and usage patterns
- Tracking changes over time
- Assessment of the impact of measures and regulations
- Use of data for operations, planning, and information
Particularly relevant for
Traffic Planning & Operations
- Decision-making basis for parking concepts and management
Tourism & Business
- Support for visitor guidance
- Clear information for guests, customers, and businesses
Public
- Current information on available parking spaces
Reuse
- Use in reports, concepts, and analyses
- Transfer to citizen information
- Combination with traffic and visitor frequency data
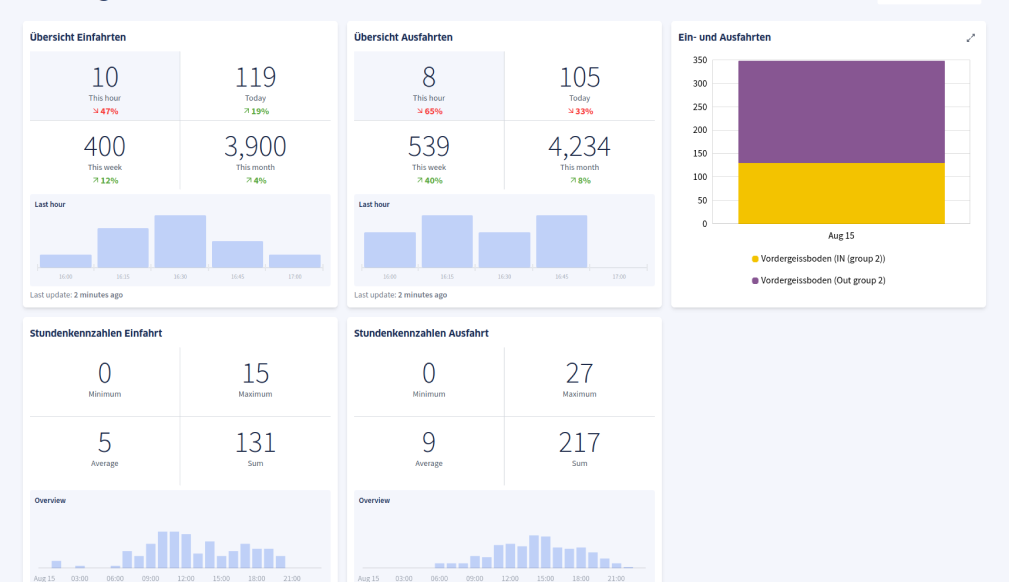
People frequencies at a glance
The package continuously displays people frequencies and utilization – indoors and outdoors. Municipalities receive a shared view of how many people are in places, areas, or spaces and how this usage changes over time. The data serves as a basis for planning, operations, and information.

Create overview
Display people frequencies and utilization centrally and comparably
Classify developments
Track changes, peaks, and temporal patterns
Use information
Use utilization and developments for communication and coordination
Challenge
People frequencies are often only recorded selectively – such as at counting points, events, in shopping streets, tourist areas, or buildings.
Without continuous overview, comparability, temporal classification, and a consistent data basis are lacking.
Approach
Citymonitor brings together relevant frequency and utilization data from different sources and displays them continuously. Counts from outdoor and indoor areas are made temporally comparable and bundled in a shared view.
This enables
- Central overview of people frequencies and utilization
- Comparison of usage across days, weeks, or seasons
- Recognition of peaks and temporal patterns
- Use of data for planning, operations, and information
Particularly relevant for
Tourism & City Marketing
- Overview of people frequencies and usage of tourist areas
- Basis for information and communication
Administration & Planning
- Traceable data basis for measures and concepts
- Assessment of developments over time
Public
- Transparent information on utilization and usage
Reuse
- Combination with traffic and parking data
- Use in reports, concepts, and analyses
- Connection to other application areas
Additional packages in the field of traffic and mobility:
Pedestrian & Bicycle Traffic
Analysis of pedestrian flows and bicycle traffic for data-based infrastructure planning and sustainable mobility.
Parking Guidance System
Web and app-based display of current utilization to avoid parking search traffic.
Tourism & Leisure Traffic
Monitoring of hiking, biking, and ski slopes for optimized visitor guidance and infrastructure planning.
Traffic Disruptions
Central aggregation, analysis, and forwarding of traffic disruptions.
... and many more.
Feel free to contact us for additional packages or custom solutions!
Schedule demo nowWhere measurable value is created
Better Planning
For strategic decisions- Track developments over time – for traffic, parking space, and people frequencies
- Comparable data basis for concepts, measures, and investments
- Make the impact of measures visible over time
Faster Assessment
For operations & daily operations- Recognize current situations and stress points
- Classify changes, peaks, and disruptions promptly
- Coordination between stakeholders based on a shared situational picture
Informed Public
For transparency & traceability- Present traffic situations, utilization, and developments in an understandable way
- Communicate measures and changes objectively
- Build trust through traceable, data-based information


Curious?
We would be happy to discuss together which of the approaches shown make sense for your municipality and what a pragmatic entry point might look like.
Needs Assessment
What are your current challenges?
Inventory
Which data sources and systems already exist?
Prioritization
Where is the greatest leverage for quick wins?
Implementation
Step by step, without creating dependencies